
Note: To use the dashboard, read the article below, then click the arrows on the dashboard to enter full screen mode. Use the dashboard to find the prevalence of COVID-19 among tested individuals within your region of interest. Then, adjust the sensitivity, specificity, and prevalence parameters to see predictive values from your selections. Compare the predicted values from your selections to the operating characteristics of approved assays in the lower right panel of the dashboard.
In order to better understand the data being reported from the COVID-19 public health emergency that has gripped the world in recent months, it is helpful to understand the mathematical and statistical considerations of binary classification tests. These include COVID-19 antigen tests (patient has the active pathogen in their body) and COVID-19 anti-body tests (patient has been exposed and has mounted an immune response).
Fundamental aspects of the mathematics involving testing analysis can be read here.
A binary classification test answers with a simple Yes/No (or equivalently Positive/Negative, Present/Not present) outcome for a condition under examination that lends itself to such a two-state outcome. The condition needs to be clearly articulated so as not to confuse the meaning of the outcome of the test, and it is generally a good idea to report the test’s result with the condition being examined. For instance, “the result of the test was positive for the presence of the COVID-19 virus.”
No testing methods or testing devices are perfect, and they have two measures of performance associated with them. These are expressed as probabilities (or proportions), when the outcome of many individual tests having been performed are considered. Since there are two possible states of the condition, only one of which is true, the performance of a binary classification test is described by:
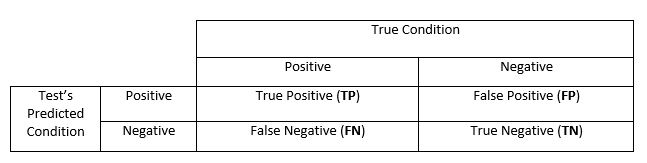
- Sensitivity (also called the true positive rate): the proportion of “positive” test results, when the true condition of the person is positive
- Specificity (also called the true negative rate): the proportion of “negative” test results, when the true condition of the person is negative
These two measures determine two other complimentary rates that are useful to define:
- If the true condition of the person is positive, the proportion of “negative” test results is 1 – sensitivity. This is the false negative
- If the true condition of the person is negative, the proportion of “positive” test results is 1 – specificity. This is the false positive
These four outcomes can be expressed in a 2-by-2 contingency table as follows:
Higher levels of prevalence enhance the performance of the declared positive cases, and it degrades performance for the declared negative cases. Conversely, low levels of prevalence has the opposite effect – enhances performance of declared negative cases and degrades the declared positive cases.There are many features of a binary classification test that can be examined by combining the true/false and positive/negative rates in a formula, depending on what is of greatest importance. It also turns out that the true prevalence of the condition being tested in the population of interest – low prevalence (i.e. small percentage of TP in the population) and high prevalence (i.e. high percentage of TP in the population) – has a profound effect on the impact of sensitivity and specificity.
Given the COVID-19 public health emergency and these testing methods, it’s possible to illustrate certain basic calculations and discover important points that deserve special attention.
COVID-19 antigen testing
Here, the condition being tested is “does the individual have active COVID-19 disease?”
The current number of confirmed cases is approximately 2.8 million confirmed cases in the US, as of July 5, 2020 according to USA Today. Certainly, many more have been infected than this, but for the moment let’s say the total cases are approximately 2.4 million. Given that the US population is currently approximately 330 million, that gives us a general prevalence of 2.4/330 = 0.7 percent.
Let’s see what impact this has on our testing performances.
Assume the COVID-19 test has a sensitivity and specificity both of 95 percent – a performance one might think is rather good. Calculating the true/false cases of positive/negative we find:
From sensitivity 95%: TP = 2.4M x 0.95 = 2.28M FN = 2.4M x (1 – 0.95) = 0.12M
From specificity 95%: TN = (330M – 2.4M) x 0.95 = 311.22M FP = (330M – 2.4M) x (1 – 0.95) = 16.38M
Among the cases declared as positive by the testing (TP + FP), the vast majority are actually false positive.
This is the impact of low prevalence degrading the quality of the declared positive cases. For the negative declared cases (TN + FN), the opposite has happened (the vast majority are true negatives). The positive predictive value (PPV) provides the percentage of true positive cases among all positive declared cases:
PPV = Count of TP / (Count of TP + FP) = 2.28M / (2.28M + 16.38M) = 12.22%
Conversely, the negative predictive value (NPV) provides the percentage of true negatives among all negative-declared cases:
NPV = Count of TN / (Count of TN + FN) = 311.22M / (311.22M + 0.12M) = 99.96%
The PPV performance is very poor, indicating that the use of this test with such low prevalence is impractical for accurately identifying positive cases. One helpful use for this test would be to rule out subjects that almost certainly do not have COVID-19 (NPV performance high).
Perhaps in a health care setting where at least half of those presenting with flu-like symptoms have COVID-19, the performance of PPV would be much better, for instance. This quality of testing might be helpful in this circumstance.
The real question is: what is driving the poor performance of the positive case identification? From the calculations above, the FP counts are the identifiable problem. To gain better performance with the PPV, testing would need to occur with stellar specificity (in the presence of low prevalence).
COVID-19 anti-body testing
Here, the condition being tested is, “has the individual been exposed to COVID-19 and mounted an immune response (assuming they have recovered)?”
One could go through the calculation exercise above with similar results, assuming a test performance of 95 percent sensitivity and 95 percent specificity. However, there is a potential goal here to achieve with PPV performance: what kind of performance would we need from an anti-body test, to assist with establishing and verifying herd immunity among the population being cleared for general unrestricted movement throughout society (i.e. going about their normal business, albeit with some reasonable precautions), without risking a flare up of COVID-19 cases?
It is speculated that if 60 to 70 percent of the unrestricted population had immunity, and the remaining without, rampant spread of COVID-19 would be stopped. The path of human to human spread finds too many dead ends (immune individuals) to propagate effectively. This is the herd immunity effect.
A test with sufficient specificity is the key.
If the test had a PPV of 60 percent, for instance. It could be used as part of a program of random testing among the unrestricted population, or used as a means of clearing individuals to become part of the unrestricted population, and therefore, it would be helpful in establishing herd immunity status.
To take one step further, assume society is in a condition where the pandemic has progressed to 5 percent prevalence among the general population – remember the prevalence level is important in calculations. Additionally, assume that the test sensitivity is 80 percent. If we’re in the business of pushing specificity as high as possible, the sensitivity necessarily cannot also be pushed very high. This is due to the nature of testing and setting thresholds (i.e. Receiver operating characteristic curves). To calculate:
PPV = 60% = Count of TP / (Count of TP + Count of FP)
= (16.5M x 0.80) / (16.5M x 0.80 + 313.5M x (1 – specificity))
Doing a bit of algebra, specificity equals 97.2 percent.
As one can see, in order for a test to be useful for surveillance in helping to detect COVID-19 cases and assist in establishing herd immunity (in the presence of low prevalence), one needs a very high specificity.
Conclusions
COVID-19 tests should focus on achieving a reasonably high sensitivity, but the critical performance measure, given a low prevalence, is specificity. A test with a specificity of 90 percent is not nearly enough, and it would be unusable in practical use, especially for COVID-19 antibody testing given a condition of low prevalence. Health workers and policy/procurement leaders should have this fact high in their minds when choosing the appropriate COVID-19 testing devices for mass purchase and use.
by Patrick Hannon, PhD, Japie Lowings, and Aditya Gadiko


